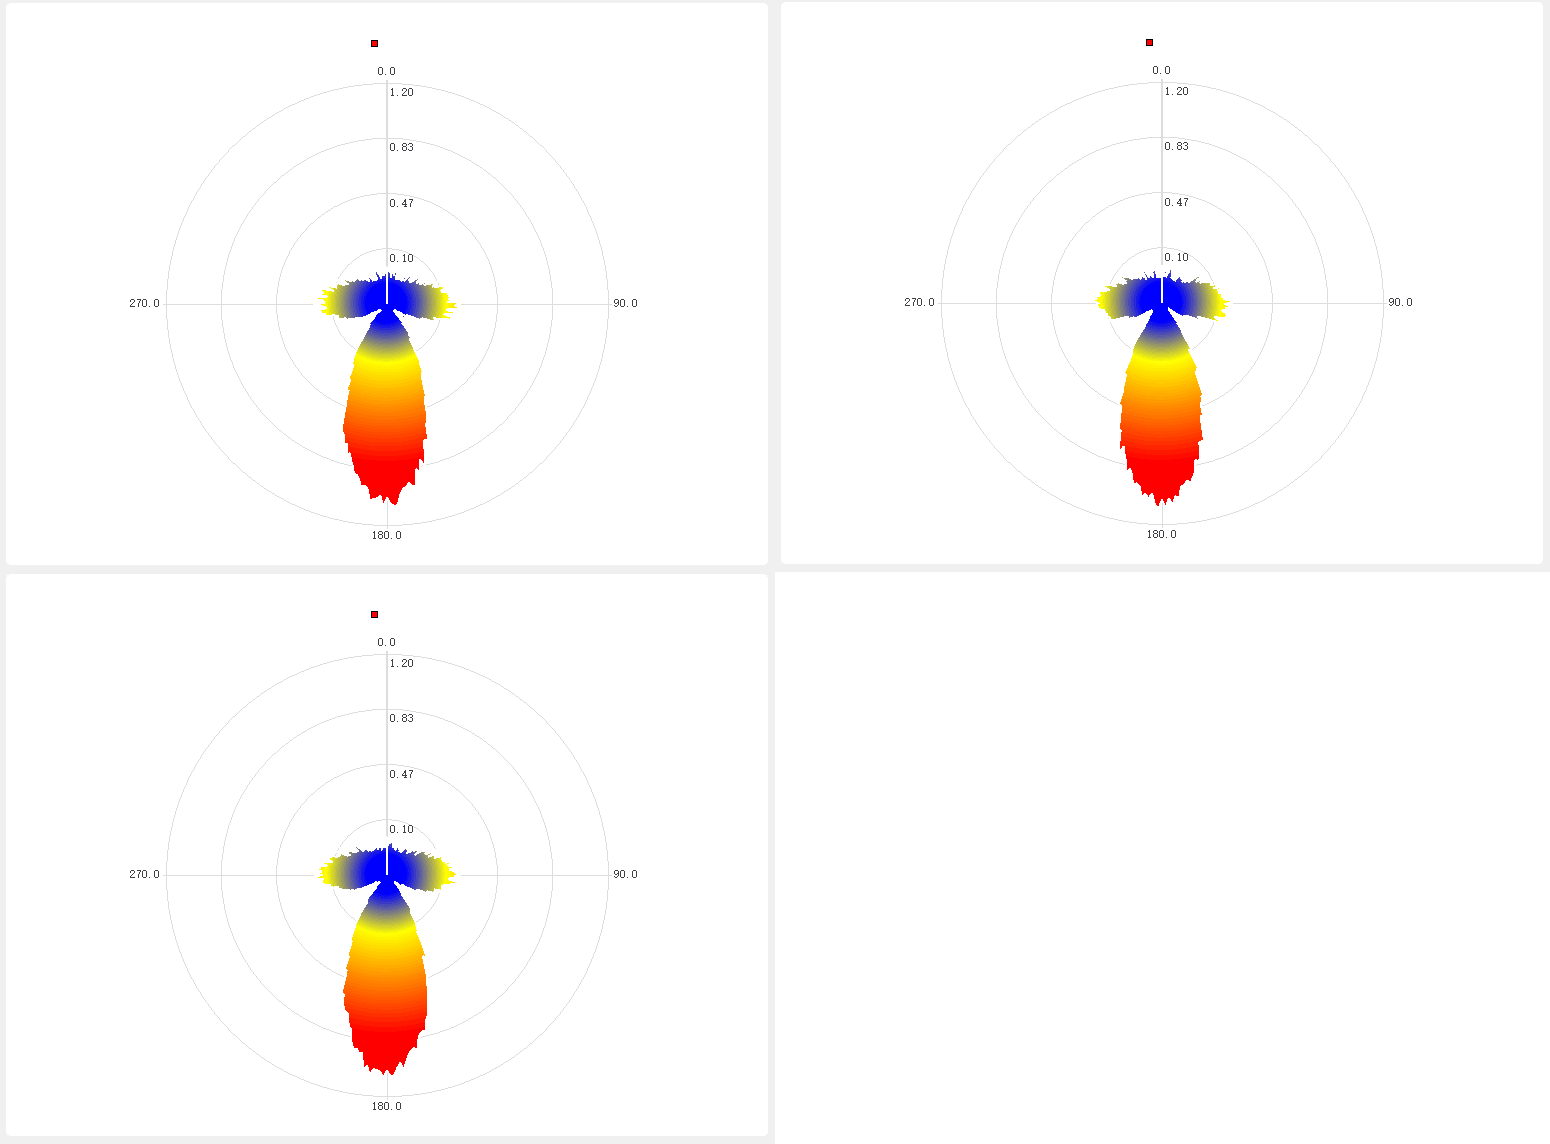
 pyqt5绘制极坐标能量图
# pyqt5绘制极坐标能量图

import sys
from PyQt5.QtWidgets import QApplication, QMainWindow
from PyQt5.QtCore import QTimer,QPointF, QPoint, Qt
from PyQt5.QtChart import QChart, QChartView, QPolarChart, QLineSeries, QAreaSeries
from PyQt5.QtGui import QLinearGradient, QColor,QRadialGradient, QBrush, QPen
import numpy as np


class MainWindow(QMainWindow):
    def __init__(self):
        super().__init__()
        timer = QTimer(self)
        timer.timeout.connect(self.update_data1)
        timer.start(50)  # 每50毫秒执行一次
        self.no = 0

        self.setWindowTitle("极坐标曲线图")
        self.setGeometry(200, 200, 800, 600)

        self.chart = QPolarChart()
        self.lineSeries = QLineSeries()
        self.areaSeries = QAreaSeries()

        self.data = []
        self.ant_demo()
        for angle in range(361):
            # radius = angle  # 这里可以根据你的需求计算半径值
            self.data.append(QPointF(angle, self.f1[angle]))
            self.lineSeries.append(angle, self.f1[angle]*1.2)

        self.areaSeries.setUpperSeries(self.lineSeries)

        # self.chart.addSeries(self.lineSeries)
        self.chart.addSeries(self.areaSeries)
        self.chart.createDefaultAxes()

        chartView = QChartView(self.chart, self)
        chartView.setGeometry(10, 10, 780, 580)

        self.style_set()

    def style_set(self):
        # 极坐标轴
        # 创建黑色的画笔
        pen = QPen(Qt.black)
        pen.setWidth(1)  # 设置线宽

        # 设置坐标轴的画笔
        self.chart.axisX().setLinePen(pen)
        self.chart.axisY().setLinePen(pen)

        # 设置刻度线的画笔
        self.chart.axisX().setGridLinePen(pen)
        self.chart.axisY().setGridLinePen(pen)

        # 设置刻度标签的颜色
        self.chart.axisX().setLabelsColor(Qt.white)
        self.chart.axisY().setLabelsColor(Qt.white)

        # 创建背景画刷 深蓝色
        background_brush = QBrush(QColor(0, 40, 80))
        self.chart.setBackgroundBrush(background_brush)

        # 创建边框画笔
        border_pen = QPen(Qt.NoPen)  # 设置边框画笔为空笔
        # 设置边框画笔
        self.areaSeries.setPen(border_pen)

        # 渐变填充
        # gradient = QLinearGradient(0, 150, 0, 300)
        gradient = QRadialGradient(QPoint(220, 220), 200)

        gradient.setColorAt(0.1, QColor(0, 0, 255))  # 蓝色
        gradient.setColorAt(0.3, QColor(255, 255, 0))  # 黄色
        gradient.setColorAt(0.8, QColor(255, 0, 0))  # 红色
        self.areaSeries.setBrush(gradient)  # 设置渐变填充效果


    def update_data1(self):

        for i in range(4):
            self.no += 1
            if self.no > 360:
                self.no = 0
            # self.data[self.no] = QPointF(self.no, 100 * (1 + np.sin(self.no / 180 * np.pi)) )
            # if self.no > 180:
            #     index = self.no - 180
            # else:
            #     index = 180 + self.no
            index = self.no
            self.data[self.no] = QPointF(self.no, self.f1[index] + 0.1 * np.random.random() )

        self.lineSeries.replace(self.data)

    def ant_demo(self):
        sita = np.arange(-np.pi / 2, np.pi / 2, 0.0087)
        lamda = 0.3
        n1 = 14
        d = lamda / 4
        beta = 2 * np.pi * d * np.sin(sita) / lamda
        z11 = (n1 / 2) * beta
        z21 = (1 / 2) * beta
        self.f1 = np.sin(z11) / (n1 * np.sin(z21))

if __name__ == "__main__":
    app = QApplication(sys.argv)
    mainWindow = MainWindow()

    mainWindow.show()
    sys.exit(app.exec_())
1
2
3
4
5
6
7
8
9
10
11
12
13
14
15
16
17
18
19
20
21
22
23
24
25
26
27
28
29
30
31
32
33
34
35
36
37
38
39
40
41
42
43
44
45
46
47
48
49
50
51
52
53
54
55
56
57
58
59
60
61
62
63
64
65
66
67
68
69
70
71
72
73
74
75
76
77
78
79
80
81
82
83
84
85
86
87
88
89
90
91
92
93
94
95
96
97
98
99
100
101
102
103
104
105
106
107
108
109
110
111
上次更新: 2024/08/26, 14:11:22
